Power BI reporting
Dashboards on one semantic model, so finance and operations read the same number for the same question, refreshed before the day starts.
Power BI · DAX · Semantic models
We design and build Fabric data platforms and Power BI reporting for growing companies: one trusted source for every number, refreshed on its own, and handed over so your team owns it.
Results from engagements and roles our founder has led.
For companies of 20 to 250 people on QuickBooks or NetSuite, a CRM and Microsoft 365, reporting usually means someone exporting, pasting and hoping it matches.
“Month-end takes two weeks.”
“Nobody trusts the numbers.”
“I can’t see margin by job.”
“Whoever built our reports left.”
Dashboards on one semantic model, so finance and operations read the same number for the same question, refreshed before the day starts.
Power BI · DAX · Semantic models
A Fabric warehouse and lakehouse that pull every source together on a schedule, and check each table before anyone sees it.
Fabric Warehouse · Lakehouse · Data Factory · PySpark
A fast site on your own domain, with hosting, DNS and business email set up so you own every piece and keep running costs low.
Websites · Domains and DNS · Hosting · Business email
Every engagement moves through the same four stages, and your data stays inside your own Microsoft tenant the whole way.
Accounting, CRM, files and APIs, pulled in on a schedule.
A Fabric lakehouse that cleans and checks every table.
One semantic model, with every measure defined once.
Reports, Excel, apps and PDFs that all agree.
Client names stay private. Every sample is rebuilt on fictional data, so you can see the work without seeing anyone’s books.
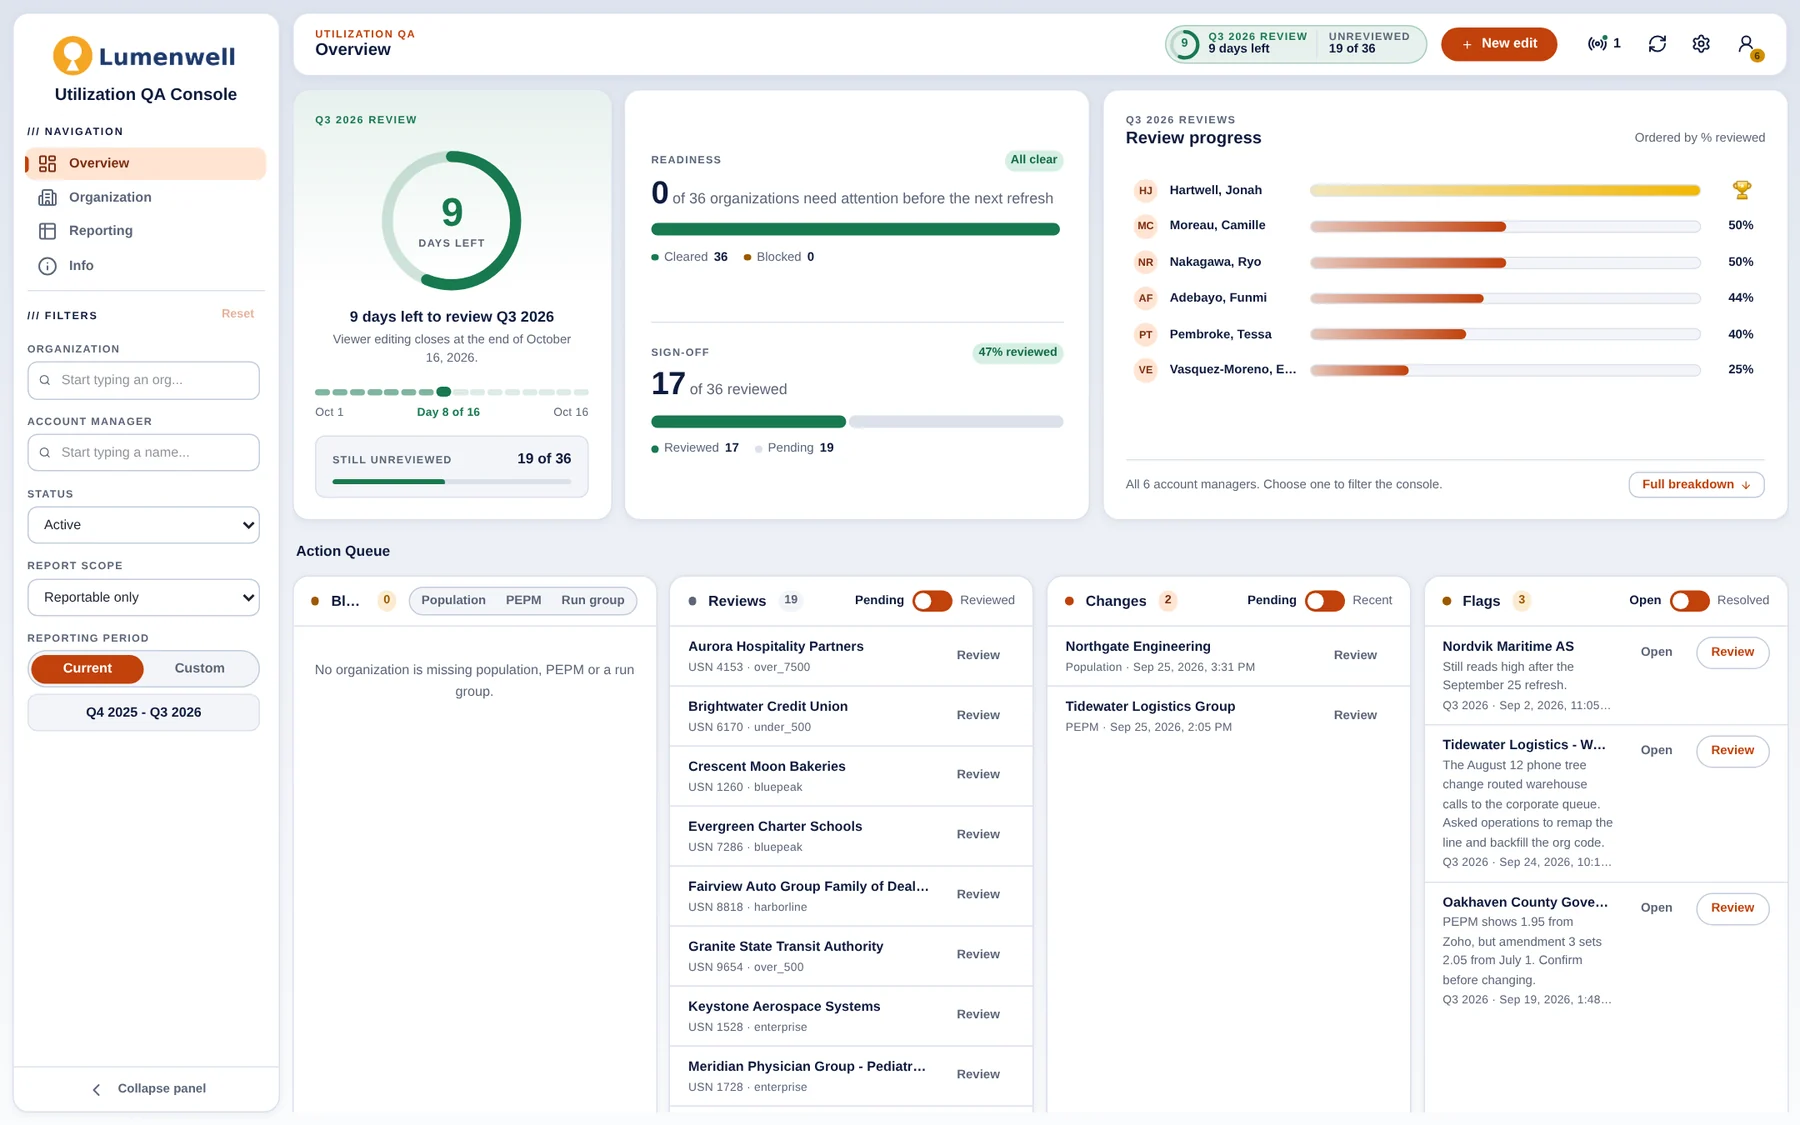
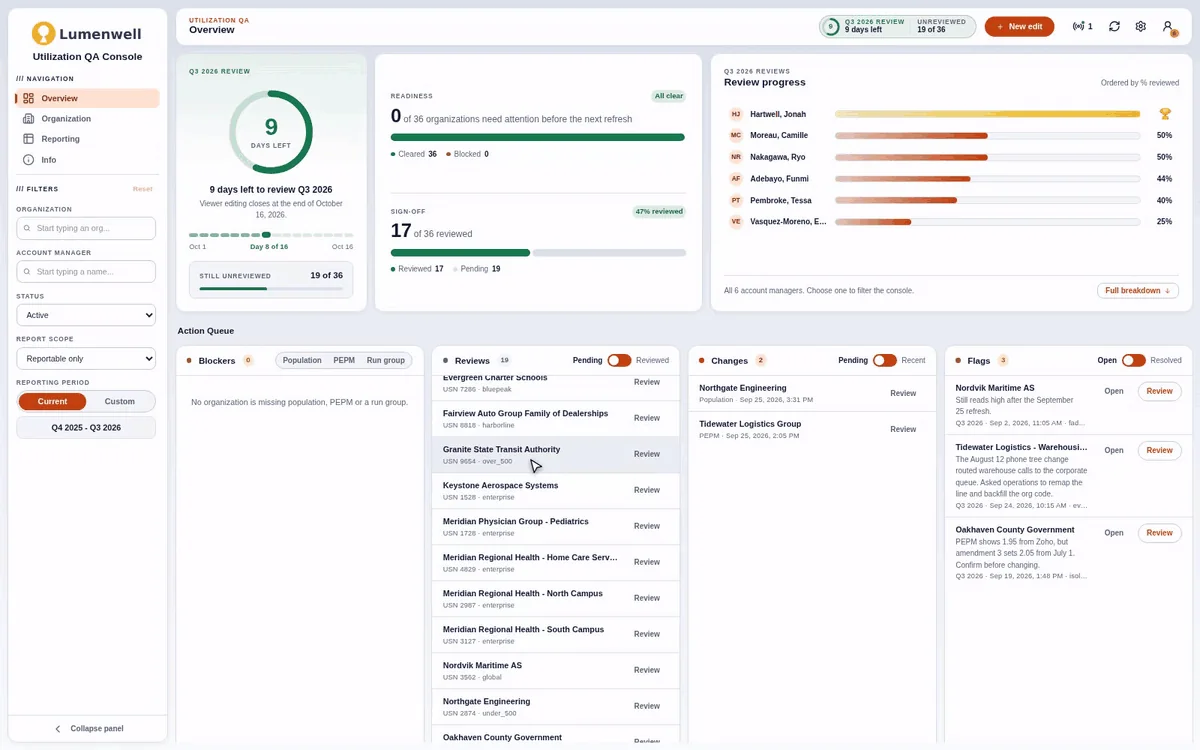 Healthcare services · Fabric appUtilization QA ConsoleA failure-prone manual QA process rebuilt as an app inside Fabric, on the same semantic model as the reports.$250K+of workload absorbedFabric SQL · DAX · ReactRead the case study APIsS3SFTPCRMGoldSilverBronze6+ sources · 50+ tables · 1 pipelineHealthcare services · Fabric platformMetadata-Driven LakehouseOne pipeline for every source. A new table onboards with a config row, and schema checks stop bad data at the door.15+ hrsof manual reporting retired each weekFabric · PySpark · Delta LakeRead the case study
More work
Urgent Care Analytics SuiteSixteen reports folded into one leadership suite, with staffing forecasts built in.Power BI · Fabric Warehouse$3M+ in savings foundUtilization Reporting ModelOne set of measures behind executive reports, the review app and client PDFs.Power BI · DAX · TMDLOne number for every questionSales Pipeline IntelligenceDaily snapshots and a self-auditing waterfall the CRM couldn’t produce.Fabric · PySpark · T-SQLPipeline history the CRM never keptContact Center IntegrationUndocumented telephony APIs mapped and load-tested before a pipeline shipped.Python · Fabric pipelinesIntegration de-risked before launchjoshuabiondo.comA fast portfolio site with its own notes editor and podcast feed, on a custom domain.React · Vite · FirebaseLive, on free-tier hostingMore work opens Joshua’s portfolio at joshuabiondo.com.
Every engagement is scoped and quoted before work begins, so you know the cost before anything starts.
Three to five Power BI pages on a semantic model, refreshed every morning and handed over.
From $6,000
Plan a buildA Fabric platform across departments: warehouse and lakehouse, pipelines, shared models, apps and governance.
Priced after a scoping call
Talk to usA fast site on your own domain, with hosting, DNS and business email set up and documented.
From $2,500
Plan a siteYour sources mapped, a one-page roadmap and one quick-win report. The fee counts toward a build within 30 days.
From $1,500
Start hereUpkeep, new reports and a monthly review call, without a full-time hire.
From $3,000 a month
Talk about a retainer
Founder and principal consultant
“Finance analyst turned data architect. I still think in P&L terms; I just build the engines now.”
Joshua has spent his career building reporting for healthcare, real estate finance and architecture firms: Fabric lakehouses, the semantic models on top of them, and the apps teams use to check their own numbers. He started Hemline Analytics to bring that setup to companies too small to hire a data team.
The person on your first call is the one who builds your model and writes your measures. No hand-offs to a junior team, and nothing lost in translation.